Unit 2: Audiological Assessment
2.1 Orientation: Sound, Physical and psychological parameters/attributes, concept of dBHL Vs dBSPL, Auditory milestones in typical children (0-2 years)
2.2 Assessment & methods of assessment: Subjective & Objective test; orientation to these tests and their importance
2.3 Audiometer: Block diagram, parts & use; Types of audiometry [sound field & close field]; role of special educators in conditioning for pure tone audiometry
2.4 Audiogram: concept , interpretation and its implication in assessing the educational needs of children with different types and degrees of hearing loss
2.5 Concept of unaided, aided audiograms, Speech spectrum and its applications
2.1 Orientation: Sound, Physical and psychological parameters/attributes, concept of dBHL Vs dBSPL, Auditory milestones in typical children (0-2 years)
Sound, and hence music, can be analyzed in two ways: physically, by using instruments to record measurements of its properties, and psychologically, by listening to the sound and ascertaining its properties on the basis of our immediate experience. Unfortunately, there is no one-to-one correlation between the physical and psychological attributes of sound. While measuring the physical properties is usually straightforward, the psychological properties are usually multi-dimensional, meaning that more than one physical property must be taken into account to describe each psychological property.
To this consideration, we must also add the fact that describing sound and music are not the same. Music puts sound into a context, in which our perception of its properties may be influenced by other events that happen in its near temporal vicinity. The same sound in different contexts may not be described in the same manner. Second, most musical sounds are truly complex, meaning that they have many different properties, most of which may be changing at any instant. Finally, we should note that ascertaining the aural properties of music is not the same thing as reacting to it emotionally, or evaluating it.
Physical Properties of Sound
1. Frequency: The period of a sound is the duration of one cycle of its motion. Its frequency is the number of cycles that occur within a second. Frequency is measured in Hertz (abbreviated Hz). The period and frequency of a sound are reciprocally related (i.e., period = 1/frequency).
The phase of a sound is the instantaneous amplitude at a given point in time. The entire cycle of a sound wave is divided into 360 equal parts called degrees. Phase is thus a measure of time with respect to frequency or period.
Human beings can perceive frequencies from about 20 Hz up to about 18,000 Hz (18 KHz), the limit varying with the individual (aging causes loss of high frequency detection).
2. Intensity: Sound intensity is a measurement of the amount of power of a sound at a given location. It is measured in decibels (abbreviated dB), which is a measurement of the ratio between the power of a given sound and a reference sound. The formula for calculating the intensity of a sound I is:
I = 10 log (I/I0)
where I0 is the reference sound. In most discussions of intensity, the reference point is taken as the threshold of hearing. The ratio of the threshold to itself is 1, and the intensity level is therefore 0 dB. Above this level, human beings can hear sounds up to a level of about 120 dB before the sound becomes physically painful.
3. Complex Sounds: Most sounds we hear, even those that have only a single perceived pitch, actually consist of several separate components whose amplitudes vary over the course of the duration of the sound. These frequency components may be divided into harmonic and nonharmonic (or inharmonic) partials. All frequency components of a sound constitute its spectrum. Modern studies of timbre further qualify the notion of spectrum to take into account a separate varying amplitude for each component.
Harmonic partials are tones whose frequencies are integral multiples of a fundamental frequency. Tones above the fundamental are called overtones. The fundamental frequency and its harmonic partials constitute a harmonic series or overtone series. Although the frequency between each successive overtone is the same, the musical interval or distance in pitch gets smaller as the series goes higher. It is a remarkable fact of sound perception that an entire collection of harmonic partials is perceived as a single pitch, with the collection itself being taken in as the timbre (see below).
A single tone with no overtones is a sine wave, which is the acoustical manifestation of simple harmonic motion. Each harmonic partial of a complex tone is a sine wave.
Nonharmonic partials are components of a sound whose frequencies are not harmonic partials of the fundamental frequency. Sounds containing nonharmonic partials do not possess a single pitch.
Noise is a sound containing a complex mix of all frequencies simultaneously, which is produced by random vibrations of air particles. White noise, so named by analogy with white light, has an even amplitude for all frequencies. Pink noise is like white noise but has a constant power per octave. (The term "noise" is also used to describe any "unwanted" sound.) Noise is always present in the background of any acoustical environment, which is why sound reproduction devices are measured by their signal-to-noise ratios, or the maximum intensity between the recorded signal and the background noise.
4. Envelope: Envelope is defined as the growth and decay characteristics of some property of sound; thus it has to be qualified by the property to which the envelope pertains. An amplitude envelope is the growth and decay of the amplitude of a sound, a spectral envelope is the growth and decay of its spectrum, etc. While envelope is recognized as a separate property because of the development of synthesizers and electronic music, it is usually not described as a property in books on acoustics.
5. Modulation: Modulation is defined as the periodic change of some property of sound. Thus, like envelope, it must be qualified by the property being modulated. The most common types of modulation are frequency modulation (abbreviated FM), amplitude modulation (abbreviated AM), timbre modulation, and location modulation. FM and AM are also known, respectively, as vibrato and tremolo.
Modulation always involves two signals: the carrier, or "original" signal before the modulation occurs, and the modulator (sometimes called the "program" signal), which changes the carrier signal. For clarity, it should also be noted that some books describe modulation as any type of change of a sound, thus including both periodic and aperiodic signals. It is more useful to refer to aperiodic change as random modulation.
There are always three characteristics involved in modulation: the speed or rate, the amount, and the shape of modulation. These characteristics are determined by the frequency, amplitude and waveshape of the modulator.
Modulation is the primary manner in which subsonic frequencies (i.e., tones below the lower threshold of frequency discrimination) occur in music. When modulation frequencies approach and exceed the lower frequency threshold, they begin to interact with the other audible frequencies in the tone, producing complex tones called sidebands. Control and manipulation of these sidebands is the manner in which FM synthesis (embodied in the Yamaha DX-7 and other instruments) occurs.
5. Reverberation: Reverberation is the cumulative effect that occurs when a sound is played in an acoustical space, where the sound that reaches the listener is a mixture of direct sound and sounds reflected off the walls, floor and ceiling, which arrive at the listener's ears at slightly delayed intervals. When a sound wave strikes a physical surface, some portion of the sounds is reflected away from the surface and some is absorbed by it. Researchers have determined that there are optimal reverberant characteristics for musical spaces, and this is therefore an important subject for architects and engineers.
While reverberation is associated with many different psychological properties, it is important to point out that it can effect the spectrum of the sound, since the reflected sound can resonate some of the partials of the tones.
Psychological Properties of Sound
1. Pitch: For many reasons, pitch is probably the most important characteristic in music. First, pitch can be broken into several distinct properties. Second, listeners are sensitive to the smallest changes in pitch. Finally, pitch organization is the primary topic of music theory.
There are at least three components of pitch that are basic to practically all music. The most basic is the "higher than" relationship, by which any tone can be described as higher, lower or the same as another. Second is the notion of octave equivalence, whereby tones an octave apart possess an "identity" with each other not shared with other pitches. Finally, two or more pitches sounding together create an "interval" or "chord" which has an additional similarity not shared by other intervals or chords.
Of all psychological and physical properties of sound, pitch is the one that practically has a one-to-one correlation with the physical property of frequency. The exception concerns only very low frequencies, which may sound flat. Whereas frequency is measured in Hz, pitch is measured by the identification of tones in the equally-tempered scale, or other musical scales.
The subject of tuning systems is very important for most music, but today we rarely discuss it since we assume equal temperament for most music. This is probably an error. The 12-tone equal-tempered scale took centuries of music history to evolve. Pianos are tuned even today in something more approaching meantone temperament, and organs are often tuned by historical methods. Live music is constantly adjusted by ear. Another topic for further investigation is the subject of intonation and pitch deviations, about which little research has been done.
2. Loudness: As pitch corresponds to frequency, loudness corresponds to intensity; but in this case, psychoacoustical research has shown that loudness is a function of both intensity and frequency. The accepted explanation for this is that the human ear itself possesses a resonance at about 3,000 Hz. Since this is rather high in musical terms, tones must be boosted progressively as they move lower to produce the perception of equal loudnesses.
3. Timbre: Timbre (pronounced "tam-ber") is defined in the literature as the property that enables a listener to identify the instrument playing the sound. It is also described as the "tone quality", the psychological property corresponding to the spectrum of a sound.
The traditional definition both helps and confuses the issue. It helps, because it identifies timbre as multi-dimensional (many different properties help identify the instrument, not just the spectrum); but it confuses because there are no easy generalizations about the similarities between one tone on an instrument and another. Especially when we accept the spectrum of a sound as multiple components, each with a separate envelope, we see that sounds are too complex for this property to be a single item. Also, in electronic music, identifying the "instrument" is not a purposeful activity, since this is often just something like a synthesizer.
There are two basic similarities by which the timbres of different pitches may be compared. The most direct is similarity of waveshape. Two sounds that have the same spectrum would thus be equal according to this definition, regardless of their pitches. This is the property that exists in common between all members of the clarinet family, since the shape of the instrument resonates only odd-numbered partials.
More important, however, is comparing tones on the basis of their formants. A formant is a fixed frequency area in which the loudest partials occur, regardless of the partial numbers. (For example, a formant at 1000 Hz would resonate the tenth partial of a 100 Hz tone, but the fourth partial of a 250 Hz tone, and the 25th partial of a 40 Hz tone.) Formants are produced by filters that resonate a particular part of the frequency continuum. It is on the basis of formant similarities that listeners identify vowels in speech, and this is probably our most innate concept of timbre. (Most vowels have three or more different formants, but usually one is most prominent.)
4. Sound Location: The location from which a sound emanates is a property always present in any sound. This is an obvious fact, and it is usually not structured in live music. In electronic music multitrack playback systems allow composers to make use of it.
5. Envelope: Envelope is a psychological property as well as a physical property, but very few studies have been made of perceptual envelopes. Musical terminology is full of terms that describe different types of articulations, such as legato, pizzicato, staccato, sforzando, etc. There are many perceptible gradations between the shortest pizzicato-like percussive tone to the legato-like organ tone, and electronic music practitioners can experiment with different values to determine what may be useful.
6. Properties associated with delays: The reverberant characteristics of musical spaces give rise to a number of identifiable properties that can be perceived by listeners. Effects devices allow the delay times to be manipulated in many ways, producing effects that go beyond what is possible in acoustic spaces.
Delay devices (which are usually digital, so these are often called "digital delays") allow a sound to be delayed for a specific duration and then mixed in with the original sound, with volume controls on both signals. Delays are usually measured in milliseconds (abbreviated ms), and are variable from about 1 to 500 or more ms (half a second). A variety of effects exist in a continuum from very short to very long delays. There are two "magic" numbers that help separate these effects. At about 40 ms, the delayed signal begins to become distinct, and at about 100 ms, it can be heard as a separate tone.
Thickening occurs below 40 ms, as the sound begins to increase in "fullness". At about 40 ms, the effect is described more as doubling, where two distinct voices can be heard. Between 40 and 50 ms the delayed sound starts to break away from the original sound and be perceived as an echo. Above 100 ms the effect is described as "slapback" echo, where the original signal has a distinct "answer" in the reflection. A continuum of different effects can be perceived from the shortest to the longest delay between these values.
Chorus effect is defined as the properties that exist when a tone is played on two or more instruments, which produces something different from merely intensifying the amplitude. It is produced by deviations in intonation, envelope, modulation, and rhythm, since two human instruments will never play precisely together. Many effects devices include a type of chorus effect produced by delaying the original sound by the "doubling" amount of time.
Effects devices also contain a number settings that are probably not distinct perceptual properties, but which are similar to those mentioned above. Reverberation itself, usually produced by a complex mixture of short delays, is both a coloring and "smearing" property, since it has filtering effects on the sound and a variety of the thickening-doubling-echo properties. Different reverberation settings allow experimentation with these values. Flanging is created by modulating the delay time, and produces a kind of "whooshing" effect.
7. Other Properties: There are many additional properties of sound that can be identified, and some that have been researched. All that is needed to determine whether some property exists is, first, that someone formulate an idea that something exists, and then to test the idea by listening for it in music. As time goes on, undoubtedly new ideas will be postulated and tested.
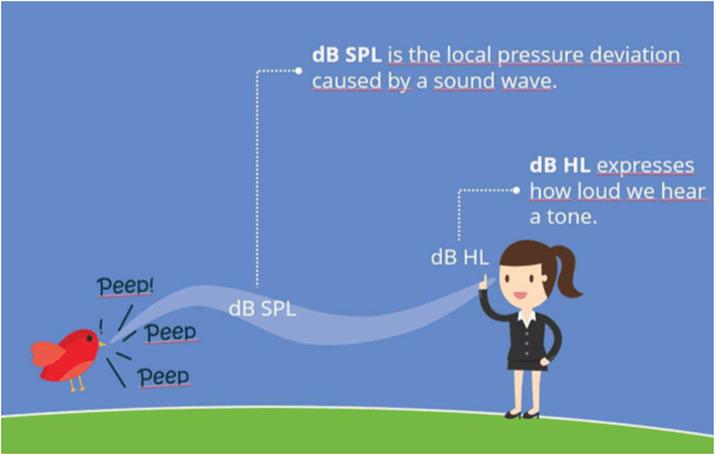
Concept of dBHL Vs dBSPL
When audiologists measure your hearing, they measure your hearing in units called decibels (dB). The catch is that there are several decibel scales. Thus, in order to be meaningful, your audiologist indicates which decibel scale she used. The two most commonly used scales are the SPL (Sound Pressure Level) and the HL (Hearing Level) scales.
The decibel (dB) takes its name from Alexander Graham Bell, the inventor of the telephone. The dB (a 10th of a Bel) was derived from the attenuation of a signal transmitted along a mile of telephone cable. The dB was linked with audiology from the beginning because this mile of attenuation was considered the smallest amount of signal change that the average listener could detect.
Sound Pressure Level (SPL)
dB SPL is the measured pressure relative to 20 micropascals. This 20-micropascal reference was selected because it was the quietest sound pressure level that a group of normal hearing test subjects could detect. dB SPL is an absolute and frequency-independent unit.
It is the unit most often used in the calibration of signals in hearing testing equipment. All other suffixes used in acoustics to describe loudness are calculated from the SPL value.
|
Sound Event |
Typical Sound Pressure Level (dB SPL) |
|
Hearing threshold |
0 |
|
Leaves fluttering |
20 |
|
Whisper in an ear |
30 |
|
Normal speech conversation |
60 |
|
Passing cars (close by) |
60 -100 |
|
Airplane taking off (close by) |
120 |
|
Human pain threshold |
120 – 140 |
Hearing Level (HL)
dB HL refers to the hearing ability of a person and gives a statement about the severity of the hearing loss. Hearing levels are measured with pure tones at different frequencies and the hearing level of an individual will vary depending on the frequency chosen.
Normal hearing is defined as 0 dB HL. If a person has a hearing loss of 60 dB HL at 1 kHz, then he or she cannot hear a pure tone that is presented below 60 dB HL.
The table below shows the conversion between dB SPL and dB HL based on ANSI S3.6-1996:
|
Sound Frequency (Hz) |
Sound Pressure Level (dB SPL) |
Hearing
Level (dB HL) |
|
125 |
45 |
0 |
|
250 |
27 |
0 |
|
500 |
13.5 |
0 |
|
750 |
9 |
0 |
|
1,000 |
7.5 |
0 |
|
1,500 |
7.5 |
0 |
|
2,000 |
9 |
0 |
|
3,000 |
11.5 |
0 |
|
4,000 |
12 |
0 |
|
6,000 |
16 |
0 |
|
8,000 |
15.5 |
0 |
A value of 0 dB HL refers to a normal hearing level at each frequency in the table above. This is taken as a point of reference at each frequency.
When an audiologist measures a person’s hearing across a range of frequencies, they produce an audiogram that will record the person’s hearing levels relative to the 0 dB HL scale.
Below is an example of an audiogram for a person in a healthy hearing range—their dB HL measurements across all frequencies are in a typical range above and below zero dB HL.

Example audiogram for a person with hearing in a typical range around normal levels (ie. 0 dB HL)
In the above audiogram, if a person has a worse than normal level of hearing at the 500 Hz frequency, for instance, then they may record a level larger than 13.5 dB SPL (say, 22.0 dB SPL), i.e., the faintest sound that they can hear at this frequency needs to be louder than normal.
his will translate to a positive number for their dB HL measure in the audiogram at this frequency (+8.5 dB HL, in this example).
Similarly, if a person has a better than normal level of hearing at the 2,000 Hz frequency, for instance, then they may record a level smaller than 9.0 dB SPL (say, 1.5 dB SPL), i.e., the faintest sound that they can hear at this frequency is softer than normal.
This will translate to a negative number for their dB HL measure in the audiogram at this frequency (-7.5 dB HL, in this example).
Normalized HL (nHL)
The notation of nHL is a reference to the frequency-specific threshold of normal hearing subjects. It describes the intensity level of stimuli used in the field of electrophysiology (ABR, ASSR, and so forth). We use a correction factor added on top of the SPL value to calculate the nHL value.
Auditory milestones in typical children (0-2 years)
The following milestones are behaviors that we would expect to see in typically-developing hearing infants and toddlers.
Birth to 5 Months
- Reacts to loud sounds.
- Turns head towards a sound source.
- Watches your face when you speak.
- Vocalizes pleasure and displeasure sounds (laughs, giggles, coos, cries, fusses).
- Makes noise when talked to.
- Begins to incorporate changes in pitch in cooing (intonation).
- Spontaneously makes raspberry sounds.
6 to 11 Months
- Understands “no-no”.
- Babbles (says “ba-ba-ba” or “ma-ma-ma”).
- Tries to communicate by actions or gestures.
- Tries to repeat your sounds.
- Attempts to imitate familiar sounds.
12 to 17 Months
- Begins to produce a variety of non-repetitive syllables such as “ba-ma” or “ba-go”.
- Pays attention to a book or toy for about two minutes.
- Follows simple directions accompanied by gestures.
- Answers simple questions nonverbally.
- Points to objects, pictures, and family members.
- Says two to three words to label a person or object (pronunciation may not be clear).
- Tries to imitate simple words.
18 to 23 Months
- Enjoys being read to.
- Follows simple commands without gestures.
- Points to simple body parts such as “nose”.
- Understands simple verbs such as “eat”, “sleep”.
- Correctly pronounces most vowels and n, m, p, h, especially in the beginning of syllables and short words. Also begins to use other speech sounds.
- Says eight to ten words (pronunciation may still be unclear).
- Asks for common foods by name.
- Makes animal sounds such as “moo”.
- Starting to combine words such as “more milk”.
- Begins to use pronouns such as “mine”.
Two to Three Years
- Knows about 50 words at 24 months.
- Knows some spatial concepts such as “in”, “on”.
- Knows pronouns, such as “you”, “me”, “her”.
- Knows descriptive words such as “big”, “happy”.
- Says around 40 words at 24 months.
- Speech is becoming more accurate, but may still leave off ending sounds. Strangers may not be able to understand much of what is said.
- Answers simple questions.
- Begins to use more pronouns such as “you, “I”.
- Speaks in two to three word phrases.
- Uses question inflection to ask for something (e.g., “My ball?”).
- Begins to use plurals, such as “shoes” or “socks” and regular past tense verbs, such as “jumped”.
|
Developmental Milestones for Listening Adapted from Cole & Flexler and Owens |
|
|
Age |
Auditory Milestones |
|
by 4 months |
|
|
by 7 months |
|
|
by 12 months |
|
|
by 24 months |
|
|
by 36 months |
|
|
by 4 years |
|
|
by 7 years |
|
2.2 Assessment & methods of assessment: Subjective & Objective test; orientation to these tests and their importance
Before an audiologist can perform a hearing test, an ENT (ear, nose and throat specialist) should examine your ear canals for any sort of obstruction such as earwax (cerumen). If you arrive to the specialist’s office for a hearing evaluation with your ears clogged, you may be asked to see an ENT to have the obstruction removed. This will ensure accurate test results and a proper diagnosis. Therefore, it is important that you prepare for your hearing test by first consulting an ENT. Once your ear canals are ready for examination, your hearing care professional will perform either a subjective hearing test, an objective hearing test, or combination of the two. All of these tests fall under the umbrella of audiometry exams, which are useful in diagnosing conductive, sensorineural, or mixed hearing loss. Most of the tests will require you to sit in a quiet, soundproof room, with headphones or earphones placed over or in your ears. The headphones/earphones are connected to an audiometer, allowing the specialist to transmit sounds to your ears and record your responses on an audiogram.
ORIENTATION AND IMPORTANCE OF SUBJECTIVE ASSESSMENT
In the subjective test, in order to determine a potential hearing loss, the cooperation of the patient is required. Usually, noises, sounds or words are played and a specific reaction sought. From the results of various tests, your ear, nose and throat doctor or audiologist can determine whether you have a conductive, sensorineural, or mixed hearing loss.
A subjective hearing test requires your cooperation whereas the objective hearing test does not. During a subjective hearing test, the specialist will play certain noises, sounds, or words and ask you to make a gesture in response to these sounds. This will allow the specialist to assess the severity of your hearing loss and recommend an appropriate treatment. Subjective hearing tests include pure-tone audiometry, speech audiometry, and reflex audiometry.
Pure-tone audiometry
A pure-tone audiometry requires you to sit in a quiet room with headphones/earphones on. The specialist will then play a variety of “pure” tones at different volumes, and you will be asked to give a signal (i.e. raise a finger, press a button) once you hear each tone. Your answers will indicate the tones you are having trouble hearing and will be recorded on your audiogram. Your threshold for a certain tone is determined by the softest level you are able to hear.
The results of your exam will show how well your outer and middle ear structures can process sounds. This is also referred to as an air-conduction test. When this air-conduction test shows a hearing loss, the specialist may perform a bone-conduction test to differentiate between conductive hearing loss and sensorineural hearing loss. The bone-conduction test is similar to the air-conduction test in the sense that the same process is utilized. Instead of headphones, a device comfortably placed behind your ear is used to transmit the tones that will pass through your skull and inner ear, bypassing your outer and middle ear. You will then be asked to respond to the tones in the same way as the air-conduction test. This method may provide a more accurate assessment of your inner ear’s hearing capacity without any interference from your outer or middle ear.
Speech audiometry
Speech is another tool that can help determine how well you hear. A hearing test that utilizes speech requires you to repeat two-syllable words while a tone gradually decreases to lower levels. The results of this test will indicate the level you are able to hear and understand certain sounds. A hearing test that utilizes speech may also include a word-recognition exam, where the specialist will ask you to repeat certain words to determine how well you are able to hear and understand speech. Comprehension is also examined by listening and repeating one-syllable words that are played at a comfortable listening level.
ORIENTATION AND IMPORTANCE OF OBJECTIVE ASSESSMENT
To reach a valid diagnosis on the type and the degree of a child’s hearing loss different test methods are employed. Usually behavioral / subjective methods are combined with objective measurements. In the following find a description of the most common objective audiometry methods used for children.
An objective hearing test is useful in identifying damage to the inner ear and assessing your quality of hearing. Objective hearing tests do not require your cooperation and are typically performed on newborns and infants. Objective hearing tests include otoacoustic emission (OAE), acoustic brainstem response (ABR), acoustic reflex test, and tympanometry.
Otoacoustic emission (OAE) test
A way to identify inner ear (cochlea) damage leading to a hearing impairment is to perform an otoacoustic emision test. During this hearing evaluation, a doctor inserts a probe that emits sounds into your ear canal. These sounds stimulate the inner ear, causing the outer hair cells to vibrate. The doctor will use the probe to measure the inner ear’s ability to produce the soft sounds created by the vibration (emissions). If the inner ear does not produce emissions, a hearing impairment may be present.
Auditory brainstem response (ABR)
An audiologist may perform this test to gain more information about your hearing sensitivity. The audiologist places a few electrodes on your head, which will measure how the hearing nerves respond to the sounds made through earphones. The information travels from the electrodes to a computer that will record the results. The audiologist will review the data and look for the softest intensity in a specific frequency range at which your hearing nerves respond.
Acoustic reflex test
An acoustic reflex test locates the possible location of a hearing impairment. This hearing test uses sounds to determine if an acoustic reflex is working properly. Depending on the loudness of the sound and your acoustic reflex (or lack of acoustic reflex), the audiologist will be able to assess the severity of your hearing loss.
Brainstem Evoked Response Audiometry (BERA)
Brain Stem Evoked Response Audiometry (BERA) is a useful tool for suspected hearing impairments in deeper areas of the brain. This test also provides evidence of other neurological diseases, which can result in loss or decreased sensitivity with respect to noise exposure such as those experienced during war zones where there were prolonged loud sounds frequently heard among soldiers who were deployed overseas.
Stapedius reflex test
The stapedius reflex test is a quick and easy way to check if your ear has any damage. It consists of applying pressure on one side, causing it to turn red in response – this happens because when we hear sounds our brain tells both sides what sound should be coming from so they contract together. If there’s no tone being sent then that means something might have gone wrong with either the outer or inner portion(s) which could result in chronic issues such as hearing loss
Tympanometry
A tympanometry allows hearing specialists to diagnose problems in the middle ear and any disorders causing hearing loss. During a tympanometry, you will hear loud tones from a probe inserted in your ear canal. This probe will measure your hearing ability, as well the movements of your eardrum as the air pressure in your ear changes during the exam. A tympanogram will record your results, and the audiologist will use this information to properly diagnose any complications with your hearing.
Audiogram
The results of your hearing tests are typically recorded on an audiogram. Therefore, it is important you understand how to read your audiogram. The purpose of the audiogram is to visually demonstrate the sounds you can hear normally and the sounds you are missing.
The audiologist charts the results of your
hearing tests on a graph called an audiogram. Graphed results usually include
your hearing threshold (the softest sounds you can hear) for a range of
frequencies for both ears.
By comparing the figures, the audiologist can
assess your degree of hearing loss and find clues to its origin. For example,
if the air and bone conduction results are the same, then the audiologist knows
that the hearing loss is caused by problems of the inner ear, and not the outer
or middle ear.
Importance of Hearing Test
It’s helpful to think of a hearing test as a screening rather than an exam. Too many people assume that hearing tests are for people who have a problem, just as vision tests are for people who have difficulty seeing. But a hearing screening doesn’t just discover hearing loss; it can uncover many physical and medical issues that you may not have known about (and which may not present any symptoms).
A regular hearing examination will allow you and your hearing care provider to:
- Diagnose medical conditions. While most hearing loss is caused by aging, some losses are a result of an underlying medical condition. Diseases such as diabetes may cause hearing problems, while high blood pressure has been linked to both hearing loss and tinnitus. Many patients are able to relieve their hearing problems by treating medical conditions they didn’t know they had!
- Identify potential problems. Much like a vision test, a yearly hearing test allows you to track changes in your hearing and make adjustments as you need them. Your hearing specialist can compare every audiogram you take to the last, allowing her to see how rapidly your hearing is changing and alerting her to potential dangers, including earwax buildup and noise-induced hearing loss.
- Prevent further damage. When hearing problems are allowed to progress, much more is lost than just the ability to hear. Patients may become depressed, suffer from anxiety in public situations, and become increasingly isolated due to the limitations of their conditions. Hearing loss has also been linked to increased injuries in the elderly, as they are less likely to hear car horns, smoke alarms, and other sounds signaling danger.
- Start treatment. Identification of a mild hearing problem can actually be a good thing, as it allows you to prevent hearing loss from getting worse. You can treat hearing loss right away in our offices, as we offer many different types and styles of hearing aids to treat a wide range of hearing problems. As an added bonus, your hearing care provider will walk you through each of your options, letting you know which device will best suit your condition as well as your lifestyle.
2.3 Audiometer: Block diagram, parts & use; Types of audiometry [sound field & close field]; role of special educators in conditioning for pure tone audiometry
Audiometry is a technique used to measure the ability to hear sounds. The process of audiometry is quite simple, consisting of three parts:
- Mechanical sound transmission (middle ear function)
- Neural sound transmission (cochlear function)
- Speech discrimination ability (central integration)
An audiometer is a subjective device that is used to evaluate the hearing threshold of a person. An audiologist or other trained personnel uses an audiometer together with special audiometric testing techniques to determine the hearing threshold and to identify as well as quantify the degree of hearing loss of a person. From these results the appropriate referral for medical treatment or possible hearing aid fitting can be prescribed. With the audiometer tones of different frequencies are presented at different levels to the patient’s ear. The hearing threshold is that level at which the person can just hear the stimulus. An audiometer is a subjective testing device, a response from the patient is needed.
An audiometry test is performed to determine how well you can hear. This may be done as part of a routine screening or in response to a noticeable loss of hearing.
The common causes of hearing loss include:
- birth defects
- chronic ear infections
- inherited conditions, such as otosclerosis, which occurs when an abnormal growth of bone prevents structures within the ear from functioning properly
- an injury to the ear
- inner ear diseases, such as Ménière’s disease or an autoimmune disease that affect the inner ear
- regular exposure to loud noises
- a ruptured eardrum
Damage to the ear or exposure to loud sounds for a long period can cause hearing loss. Sounds louder than 85 dB, such as you hear at a rock concert, can cause hearing loss after only a few hours. It’s good to use hearing protection, such as foam earplugs, if you’re exposed to loud music or industrial noise on a regular basis.
Sensorineural hearing loss occurs when hair cells in the cochlea aren’t working properly. The cochlea is the part of the ear that translates sound vibrations into nerve impulses to be sent to the brain. Sensorineural hearing loss can also occur due to damage to the nerve that carries sound information to the brain or damage to part of the brain that processes this information. This type of hearing loss is usually permanent. It can be mild, moderate, or severe.
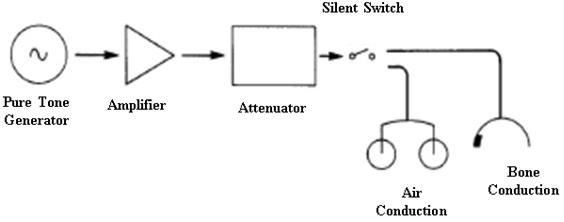
Block Diagram Representation of an Audiometer.
Audiometers can be divided into two general categories: screening and clinical. Screening audiometers perform rapid, semi-automated determinations of threshold hearing levels. They are used to quickly determine whether or not there is a measurable hearing loss. Some are capable of testing multiple individuals simultaneously and are used in schools for mass screening programs and in industrial operations to periodically test the workforce. Some screening audiometers adjust the results for age.
Parts of Audiometer
All legacy audiometers are comprised of four sections—the oscillator, amplifier, attenuator, and headphones. The oscillator produces the audio frequencies generated during the examination. The amplifier increases the sound level of the output of the oscillator. The attenuator controls output of the amplifier and provides a precise sound level. The headphones provide the precise sound level to each of the test subject's ears. Microprocessor and computer-controlled audiometers perform the same functions, but the sections are less discernible since the process is software controlled. During the hearing test, a tone is repeatedly presented at an increased sound level (volume) until the person acknowledges hearing the sound. The lowest sound level at which the test subject hears the tone is called the threshold. The oscillator is changed to the next frequency being tested and this process is repeated with the new tone.
· .Attenuators / Hearing level dials to change dB HL level presented to the patient
· Interrupter Switch to turn the beep on and off and control the duration of the beep
· Function Selector to change between Air, Bone and Speech Sounds
· Talk Forward- To talk to the patient through the headphones
· Earphones/Headphones, Bone conduction oscillator receiver
· Frequency Indicator to change with frequency
· Presentation Indicator to change the tone from steady state, continuous, pulsed continuous to warble
· Microphone
· Voice VU Meter to change the volume of your own voice in the audiometer
· Masking indicator to produce white, narrow-band or speech noise
More In depth Audiometer Parts
· Oscillator- The part that generates the pure tones, very accurate +/- 3% accurate
· Equalization Circuit- Contains resisters that equalize the sound generated since the human ear more sensitive to its resonance frequencies around 2,700 Hz
· Output Power Amplifier- Signals produced by the amplifier are amplified here, almost no distortion produced here
· Output Transducers- The earphone, bone conduction receiver, loud speakers
Purpose of an audiometry test of sound
An audiometry test of sound assesses a person’s hearing abilities. The loudness (intensity) of sounds and the speed at which sound waves vibrate varies (tone).
Sound waves activate the nerves in the inner ear, which causes hearing. The sound then gets to the brain through nerve connections.
The eardrum, ear canal, and middle ear bones can all carry sound waves to the inner ear (air conduction). They can also travel through and behind the ear’s bones (bone conduction).
Types of Audiometers
Pure Tone Audiometry
Pure-tone audiometry is widely regarded as the gold standard for assessing auditory sensitivity. Pure-tone audiometry is used to detect the amount of hearing loss and its etiology. It aids in the determination of hearing thresholds at various frequencies.
Pure-tone audiometry ranges from basic, low-cost devices to complicated, high-cost diagnostic audiometers. A pure tone is supplied to the ear through an earphone in this test, and the decibel level at which the tone is perceived 50% of the time is measured (dB). The term ‘threshold’ refers to this measurement. The audiogram is a graph that represents the output. Specific frequencies spanning from 250 to 8000 Hz are used in the testing method.
Speech Audiometry
The goal of speech audiometry is to evaluate the hearing abilities and examine the integrity of the complete auditory system. Speech audiometry can be used to identify the type of hearing loss that is occurring. Speech reception threshold and speech discrimination tests are two types of speech audiometric tests.
Both tests are designed to find the lowest decibel level at which a patient can properly repeat 50% of the phrases. Speech reception threshold tests employ two-syllable words with equal stress (sometimes known as “spondees”), whereas speech discrimination tests use monosyllable test items.
Suprathreshold audiometry
Suprathreshold audiometry is a kind of audiometry that measures sound levels above the threshold. Patients with varying degrees of hearing loss in both ears have a rise in perceived loudness in response to a slight increase in intensity, which is known as recruitment.
Suprathreshold audiometry is a type of recruitment detection test. It aids in determining if the listener can properly recognize the speech at a regular conversational speech level. This test can also identify the benefits to a patient from wearing a hearing aid.
Self-recording audiometry
Bekesy audiometry is another name for self-recording audiometry. George von Bekesy was the first to offer this test of sound in 1947. With the aid of a motor, the frequency and intensity are automatically modified in this method.
The frequency may be adjusted in either a forward or backward direction. A recording attenuator is used in this hearing test. The attenuator may either decrease or increase the signal strength at a set rate of so many dB per second. The listener can control the attenuator’s activity.
Impedance audiometry
Impedance audiometry measures the air pressure and mobility of the middle ear reflexes and also the middle ear system.
Computer-administered (microprocessor) audiometry
In 1975, the first microprocessor audiometer for commercial purposes was released. A multifunctional keypad is found on most microprocessor audiometer instruments. Microprocessor audiometers have several benefits over manual and self-recording audiometers.
Subjective audiometry
The individuals are instructed to reply when they hear the delivered sound in this test. This audiometric test of sound may offer the subjects a variety of sound stimuli and record their reactions.
Objective Audiometry
Unlike subjective audiometry, this test does not rely on the patients’ replies. The subjects, on the other hand, are requested to cooperate when the probes and measuring electrodes are attached for the objective test.
Sound Field Testing
Sound field testing refers to the method of audiology testing that takes place in a sound-isolated room via speakers. It is performed without the use of headphones or in-ear sound devices. It’s commonly used for young children who are unwilling to wear headphones during aided testing. Adults can also use this testing if they prefer it over alternative methods. An additional reason for sound field testing is to evaluate hearing aid performance.
ROLE OF SPECIAL EDUCATORS IN CONDITIONING FOR PURE TONE AUDIOMETRY
Pure-tone audiometry is a behavioral test used to measure hearing sensitivity. This measure involves the peripheral and central auditory systems. Pure-tone thresholds (PTTs) indicate the softest sound audible to an individual at least 50% of the time. Hearing sensitivity is plotted on an audiogram, which is a graph displaying intensity as a function of frequency.
Conditioned play audiometry may rely on one or more of the following games:
· Blocks or balls: Using positive reinforcement, the screener "trains" the child to place blocks or balls in a basket whenever he hears a tone.
· Pegs: As with blocks, the screener teaches the child to place pegs in a hole whenever she hears a sound.
· Rings: Like the above, the screener teaches the child a simple game. In this case, the child places a ring over a cone when he hears the beep.
· Tablet games: A 2013 study found that a tablet-based audiometer might give audiologists another way to perform hearing tests on young kids in the future. The child plays simple games on an iPad or other device and receives rewards similar to the above.
Conditioned play audiometry takes place in a soundproof booth or sound-treated room. There are two parts to CPA: conditioning and screening.
· Conditioning: During this phase, the audiologist will tell your child that they are going to play a game. She will begin by pressing the tone and getting the child excited by saying, "Wow, you get a block!" The screener then gives the child the toy. She then tells the child to place the block in a basket every time she hears the beep. She will then work with your child to perform the task as quickly as possible. Once the child understands the game, screening can begin.
· Screening: For screening, the audiologist will place headphones (or earphones) on your child. If necessary, bone conduction testing may be employed (in the case of wax or fluid in the ears). The test continues as above, while the audiologist reduces the intensity of the sound until the child's minimum hearing threshold is achieved.
Tests continue using different frequencies until the audiologist has a complete set of data about your child's hearing in both ears.
Conclusion
An audiometer is a device that measures hearing acuity. They typically comprise an embedded hardware unit coupled to a set of headphones and a feedback button for the test participant, which is occasionally operated by a conventional PC. To assess conductive hearing processes, such devices can be combined with bone vibrators.
ENT (ear, nose, and throat) clinics and audiology facilities include audiometers as standard equipment. Software audiometers, which come in a variety of configurations, are an alternative to hardware audiometers. A regular computer is used to screen PC-based audiometers. Hospitals, audiology centers, and research institutions are the most typical places to find them. Industrial audiometric testing is also done using these audiometers.
2.4 Audiogram: concept , interpretation and its implication in assessing the educational needs of children with different types and degrees of hearing loss
One of the most fundamental hearing tests is pure tone audiometry. For this test, a hearing professional, or an audiologist, uses an audiometer to generate tones. These tones vary in frequency, or pitch, measured in Hertz (Hz), and volume, measured in decibels (db).
The test assesses a person’s left and right ear separately.
When an audiologist plays a pure tone, or a sound with a single frequency, a person needs to signal when they hear the sound, typically by raising their hand or pressing a button.
An audiologist determines a person’s hearing threshold for various frequencies. The hearing threshold is the softest sound a person can hear at least 50% of the time. A person needs to wear a headphone and a bone conductor during an audiometer test. These measure a person’s hearing thresholds through air conduction and bone conduction, respectively.
Sometimes, an audiologist may apply a masking noise on the non-test ear to prevent it from participating in the other ear’s test. Most specialists mask during bone conduction tests. Also, most mask for air conduction tests when thresholds reach 40 db or louder in over-the-ear earphones, or 60 db for in-ear earphones.
An audiogram records a person’s left and right ear’s air and bone conduction threshold.
An audiogram is a hearing test conducted under ideal listening conditions in a soundproof booth.
The test includes different pitches and intensities, with the results conveyed in graphical form. If there is hearing loss, an audiogram helps distinguish conductive loss (outer/middle ear) from sensorineural loss (cochlea/cochlear nerve).1
As well as differentiating hearing loss (conductive vs sensorineural), specific patterns seen on audiograms can aid in identifying the underlying cause of the hearing loss.
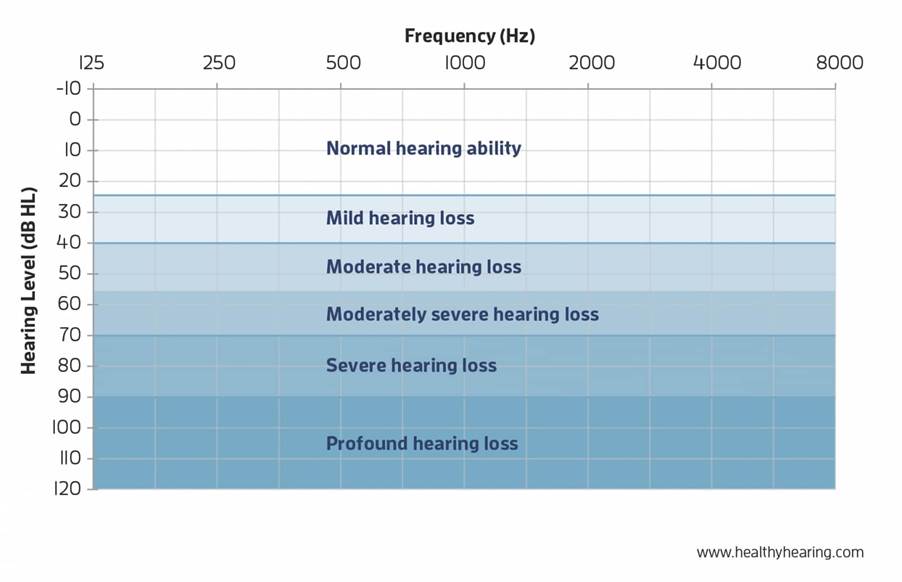
Hearing thresholds
· Normal hearing: can hear quiet sounds of less than 20dB
· Mild hearing loss: hearing loss between 20 – 40dB
· Moderate hearing loss: hearing loss between 41 – 70dB
· Severe hearing loss: hearing loss between 71 – 95dB
· Profound hearing loss: hearing loss over 95dB
Hearing loss is often classified as slight, mild, moderate, moderate-to-severe, severe or profound. They will also describe the pattern of your loss, generally as flat, sloping or rising.
The space between the normal hearing area and your threshold symbols represents all of the sounds you’re missing because of your hearing loss. The bigger the space, the more sounds you’re not hearing. For most people with hearing loss, hearing aids can be a solution to bridge that gap and give you back the sounds you’re missing.
How to read an audiogram
Looking at the audiogram graph, you will see two axes:
The horizontal axis (x-axis) represents frequency (pitch) from lowest to highest. The lowest frequency tested is usually 250 Hertz (Hz), and the highest is usually 8000 Hz. You can think of the frequency axis like the keys on a piano where the sounds become higher pitched as you progress from left to right. Most speech falls into the 250 to 6000 Hz range, with the vowel sounds among the lowest frequencies and the consonants such as S, F, SH, CH, H, TH, T and K sounds among the highest frequencies.
The vertical axis (y-axis) of the audiogram represents the intensity (loudness) of sound in decibels (dB), with the lowest levels at the top of the graph. Although the top left of the chart is labeled -10 dB or 0 dB, that does not mean the absence of sound. Zero decibels actually represents the softest level of sound that the average person with normal hearing will hear, for any given frequency. (It's actually a normative curve that has been straightened out!)

Symbols on an audiogram
Air conduction
O = Right ear unmasked
△ = Right ear masked
X = Left ear unmasked
▢ = Left ear masked
Bone conduction
< = Right ear unmasked
[ = Right ear masked
> = Left ear unmasked
] = Left ear masked

How Does Hearing Loss Affect Children?
Conductive Hearing Loss
Audiological Implications
– Hearing loss may be bilateral (both ears) or unilateral (one ear)
– Hearing loss may be fluctuating, permanent, or temporary
– Children may have difficulty
• With auditory reception and consistently organizing auditory information
• Understanding speech
• Understanding in adverse listening conditions
• Localizing sounds and understanding speech in the presence of competing noise (unilateral hearing loss)
• Loss of binaural listening advantage (unilateral hearing loss)
– Medical consultation and/or monitoring may be indicated
– The use of personal and/or group amplification and/or hearing assistive technology should be considered if hearing loss cannot be resolved through medical treatment
Communication Implications
– Children may have
• Difficulty forming linguistic categories (plurals, tenses)
• Difficulty differentiating words and sounds
• Receptive and/or expressive language delay
• Problems with articulation
Academic Implications
– Children may have
• Lower scores on achievement and verbal IQ tests
• Poor reading and spelling performance
• Greater need for enrolment in special education or support classes
• Lower performance on measures of social maturity
Sensorineural Hearing Loss
Audiological Implications
– Hearing loss may be bilateral or unilateral
– Children can exhibit
• Difficulty understanding speech and with auditory discrimination
• Significant problems listening and understanding in noisy and reverberant environments
• Difficulty localizing sounds and understanding speech in the presence of competing noise (unilateral hearing loss)
• Loss of binaural listening advantage (unilateral hearing loss)
– Use of personal and/or group amplification and/or hearing assistive technology should be considered
Communication Implications
– Children typically exhibit delays and/or difficulty with
• Tasks involving language concepts
• Auditory attention and memory, and comprehension
• Receptive and expressive language
• Syntax, semantics, and vocabulary development
• Speech perception and production
Academic Implications
– Children typically exhibit
• Lags and deficits in academic achievement, including language arts, vocabulary development, reading, spelling, arithmetic, and problem-solving
• Verbally based learning difficulties
• Progressive educational delays
– In addition, children with sensorineural hearing loss may have
• High rates of grade repetition and academic failure
• Self-described feelings of isolation, exclusion, embarrassment, annoyance, confusion, and helplessness
• Less independence in the classroom
• Lags in psychosocial development
– Increased need for special education and/or classroom supports
Mixed Hearing Loss Implications
– Hearing loss may be bilateral or unilateral, with various components of both sensorineural and conductive hearing losses.
– As with conductive and sensorineural hearing losses, a variety of audiological interventions and referrals may be indicated.
– Children can exhibit some or all of the audiological, communication, and academic implications of sensorineural and conductive hearing losses.
Central Auditory Processing Disorder Implications
– Hearing sensitivity is typically normal but a hearing loss could be present.
– Children may
• Behave as if they have hearing loss
• Score lower on measures of verbal IQ than on measures of performance
• Require more help with organization in the classroom
• Have difficulty following multiple step directions
• Refuse to participate in class discussions or respond inappropriately
• Act withdrawn or sullen
• Have a history of chronic ear infections or other otologic and/or neurologic problems
• Have poor singing and music skills
• Have deficiencies in fine and/or gross motor skills
2.5 Concept of unaided, aided audiograms, Speech spectrum and its applications
Aided Audiogram thresholds may be provided on an audiogram as a means of confirming the audibility of test sounds at different frequencies.
This testing may be done as part of guidance counseling, verifying the programmed amplification of a bone conduction aid or a cochlear implant, verifying that frequency lowering is effective in a hearing aid, and assessing functional gain when real ear microphone measures can’t be taken.
The spectrum of speech
The spectrum of speech covers quite a wide portion of the complete audible
frequency spectrum. In non-tonal languages, one can say that speech consists of
vowel and consonant sounds. The vowel sounds are generated by the vocal chords
and filtered by the vocal cavities. A whisper is without voiced sounds.
However, the cavities that contribute to the formation of the different vowels
still affect the passing flow of air. This is why the characteristics of vowel
sounds also occur in a whisper. In general, the fundamental frequency of the
complex speech tone – also known as the pitch or f0 – lies in the range of
100-120 Hz for men, but variations outside this range can occur. The f0 for
women is found approximately one octave higher. For children, f0 is around 300
Hz.
The consonants are created by air blockages and noise sounds formed by the
passage of air through the throat and mouth, particularly the tongue and lips.
In terms of frequency, the consonants lie above 500 Hz.
At a normal vocal intensity, the energy of the vowels usually diminishes
rapidly above approximately 1 kHz. Note however, that the emphasis on the
speech spectrum shifts one to two octaves towards higher frequencies when the
voice raises. Also, note that it is not possible to increase the sound level of
consonants to the same extent as vowels. In practice, this means that the
intelligibility of speech does not increase by shouting, compared to applying
normal vocal effort in situations where the background noise is not
significant.

Formants
If you listen to two people who speak or sing the same vowel at the same pitch
(f0), the vowels are presumably recognizable as identical in both cases.
However, any two voices do not necessarily produce exactly the same spectrum.
The formants provide the perceived vowel sounds. Also, the formants provide
information different from speaker to speaker. The formants are explained by
the acoustic filtering of the spectrum generated by the vocal cords. Vowels are
created by the “tuning” of the resonances of the cavities in the vocal tract.
A speech spectrum is either high-pass or low-pass filtered. Using an HP filter at 20 Hz (upper left) leaves the speech 100% understandable. (This is because the complete speech spectrum is there). An HP-filter cutting everything below 500 Hz still leaves the speech signal understandable. Even though most of the speech energy is cut out, the intelligibility is only reduced by 5%. However, applying a higher cut-off makes intelligibility drop.
A lot of research has been carried out in this area. In general, the results demonstrate that:
· Optimum speech level is constant when background noise level is lower than 40 dB(A)
· Optimum speech level appears to be the level that maintains around 15 dB(A) of S/N ratio when the background noise level is more than 40 dB(A)
· Listening difficulty increases as speech level increases under the condition where S/N ratio is good enough to keep intelligibility near perfect
Furthermore, the 1-4 kHz frequency range should be “kept clear”. When, for instance, adding music as background for narration, a parametric equalizer cutting the music 5-10 dB in this frequency range will improve intelligibility.
Listeners with moderately impaired hearing can usually achieve high speech intelligibility in a quiet environment when the presentation level is sufficiently high, but their performance decreases in noisy environments (Moore, 2007). The ability to understand speech in quiet may be determined to a large extent by audibility, but the ability to understand speech in noise almost certainly depends partly on other auditory functions such as frequency selectivity and sensitivity to temporal fine structure. Sensorineural hearing loss, particularly cochlear hearing loss, is associated with broader-than-normal auditory filters (Glasberg and Moore, 1986). When a speech signal passes through these broader filters, the resulting excitation pattern is “smeared” relative to normal, reducing the difference in amplitude between peaks and dips in the internal representation, and making it more difficult to determine the formant frequencies that provide important cues for speech recognition. Background noise can exacerbate this effect by filling in the valleys in the spectrum, thereby reducing spectral contrast in the signal.
Hearing-impaired people probably have a reduced ability to detect and discriminate spectral changes simply because they have reduced frequency selectivity. If the detection and discrimination of static spectral features is impaired, then it naturally follows that the detection of changes in those features will also be impaired. Spectral enhancement on a frame-by-frame basis, as described above, cannot restore the internal representation of spectral shape to normal; it can only make the excitation pattern of a spectrally enhanced stimulus in an impaired ear somewhat closer to the excitation pattern evoked in a normal ear by the unprocessed signal (Baer, 1993). For example, a single sinewave evokes an excitation pattern that is broader in an impaired than in a normal ear, and there is no way to enhance the spectrum so as to restore the excitation pattern to normal.
Although spectral-change enhancement also has limitations, it is possible in principle to make spectral changes audible that would not otherwise be audible for a hearing-impaired person. Say, for example, that a broadband stimulus has a narrow spectral dip that is then “filled in” to give a flat spectrum. For a hearing-impaired ear, the change might not be detectable, since the narrow spectral dip would give rise to only a very small dip in the excitation pattern. If the stimuli are analyzed with a finer frequency analysis than performed by the impaired ear, and the spectral change is then enhanced, the result would be a momentary peak in the spectrum following filling in of the dip; this effect is illustrated later. The hearing-impaired person might be able to detect this spectral peak, and hence to detect the change in spectrum over time. Thus, spectral-change enhancement has the potential for increasing the audibility of spectral changes for hearing-impaired people, possibly thereby increasing speech intelligibility.